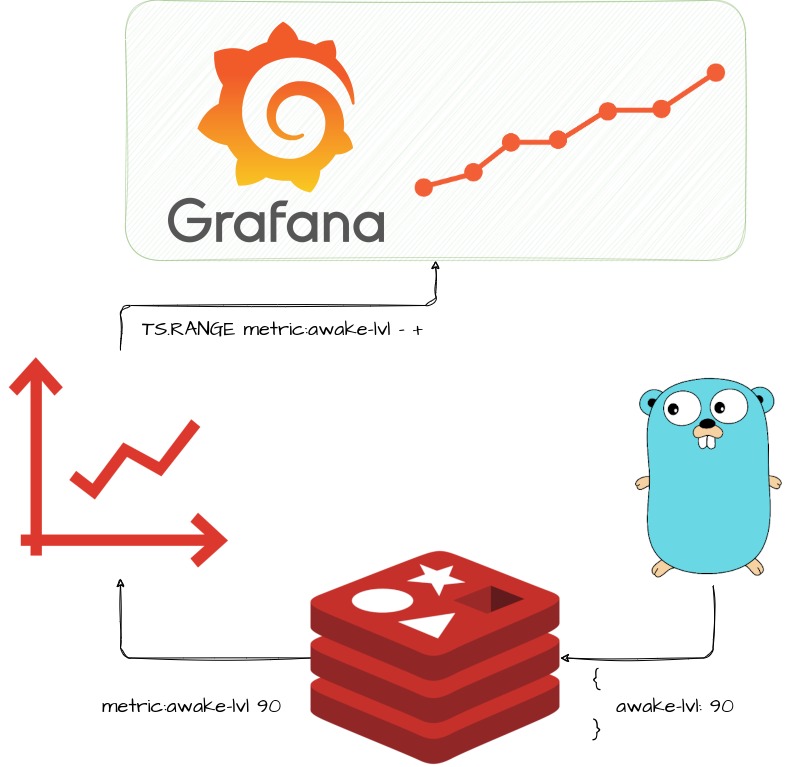
Redis TimeSeries + Go: Structs to Key Values
Most of you know Redis as a key-value database, but did you know there is a module that simplifies the use of Redis for time series use cases? In this post I will explain a simple way to store time series data in Redis using Go and visualize it in Grafana. The Go script is designed to be easily adaptable to new use cases, like using a Raspberry Pi to save system metrics (it will reduce the number of write cycles in SD card because the data will be stored in RAM).

Redis TimeSeries is a Redis module that adds a time series data structure to Redis.
Features:
- High volume inserts, low latency reads
- Query by start time and end-time
- Aggregated queries (min, max, avg, sum, range, count, first, last, STD.P, STD.S, Var.P, Var.S, twa) for any time bucket
- Configurable maximum retention period
- Downsampling/compaction for automatically updated aggregated timeseries
- Secondary indexing for time series entries. Each time series has labels (field value pairs) which will allows to query by labels
Memory model
A time series is a linked list of memory chunks. Each chunk has a predefined size of samples. Each sample is a 128-bit tuple: 64 bits for the timestamp and 64 bits for the value.
Why use Redis TimeSeries?
I chose this database to run in a Raspberry Pi project where persistence is not a problem and also to avoid excessive writes in a SD card. Another reason is because Redis already has an integration with Grafana. However, there are other good time series databases if persistence is a must: InfluxDB, Kdb+, Prometheus, TimescaleDB, CrateDB …
Project structure
├── config
│   └── config.toml
├── internal
│   ├── config
│   │   └── config.go
│   ├── metrics
│   │   ├── metrics.go
│   │   └── system
│   │       └── system.go
│   └── redis
│       ├── redis.go
│       └── storage
│           └── metrics.go
├── docker-compose.yml
├── main.go
You can find the project in the following Github link:
https://github.com/ddavidmelo/redis-timeseries
Main
Let’s start by looking at the infinite loop function responsible for calling customizable functions to collect data and publish them to redis.
1
2
3
4
5
6
7
8
9
10
11
12
13
14
15
16
17
18
19
20
21
22
func PublishLoop() {
  ticker := time.NewTicker(config.GetGeneralConfig().PublishRate)
  quit := make(chan struct{})
  createRules := true
  for {
    select {
    case <-ticker.C:
      go func(createRules bool) {
        //Add new metrics to publish here:
        systemMetrics := system.GetSystemStatus()
        metrics.PublishMetric("system", &systemMetrics, createRules)
        //
      }(createRules)
      createRules = false
    case <-quit:
      ticker.Stop()

      defer wg.Done()
      return
    }
  }
}
Inside the for loop the period of the ticks is specified by the duration variable ticker (equals to the variable pub_rate in the configuration file). So every X seconds, some system metrics are collected and published (PublishMetric) to Redis. There is also a parameterizable variable createRules that is responsible for creating a rule to aggregate data. This data aggregation is also a feature of the Redis TimeSeries, which is very useful for compact time series. With that, we can have samples every 1s and compact them to have an average every 1h.
Manipulate structure data & Publish metrics
After collecting an object with the following struct:
1 |
|
Is necessary to convert this struct to a key-value pair to insert in Redis.
Examples:
- NetworkSending ➡ system:NetworkSending
- CPUPercentage[0] ➡ system:CPUPercentage:0
1 |
|
The idea of this PublishMetric function is to accept a random object with arbitrary types and convert it to a key-value pair.
To do this, I will use the reflect package to manipulate the object in order to extract the property names and values. First it is necessary to loop every entry in the object reflect.ValueOf(values).Elem(). After that, it will be created the Redis Key by doing a concatenation with these variables: keyName + ":" + metric. It is also created a Redis TS label with name metric and with the value of the variable metric.
Before setting this entry in Redis it is done a validation if the value is an array or a slice, if this is true, a trailing index is added to the Redis Key.
Data Aggregation
When a sample is inserted it is possible to change in the configuration file the retention time (retention_sample_duration). But … do we want to have in memory every sample for a long period of time? No, that is why the data aggregation is performed on every key. This aggregation does an arithmetic mean of all values in a new key with the name finishing with “_avg” and with one extra label, with name aggregator and with the value avg. Example:
- system:NetworkSending - system:NetworkSending_avg
The retention time and the aggregation bucket duration of this aggregation key can be configured in the configuration file by changing the following parameters: retention_aggregation_duration, aggregation_bucket_duration.
The Redis Time Series supports other aggregation types:
- avg Arithmetic mean of all values
- sum Sum of all values
- min Minimum value
- max Maximum value
- range Difference between the highest and the lowest value
- count Number of values
- first Value with lowest timestamp in the bucket
- last Value with highest timestamp in the bucket
- std.p Population standard deviation of the values
- std.s Sample standard deviation of the values
- var.p Population variance of the values
- var.s Sample variance of the values
- twa Time-weighted average over the bucket’s timeframe (since RedisTimeSeries v1.8)
Final results
After running docker-compose up, run go run main.go in the project folder.
If you access http://127.0.0.1:3000 you will find a premade Dashboard like this:
